Back to Portfolio
Local Fabric & Tailoring Business

Tailor Fabric Sales Analysis Dashboard

An interactive Power BI dashboard developed to analyze fabric sales, profitability, design performance, and category-wise business trends, replacing manual calculations with data-driven reporting.
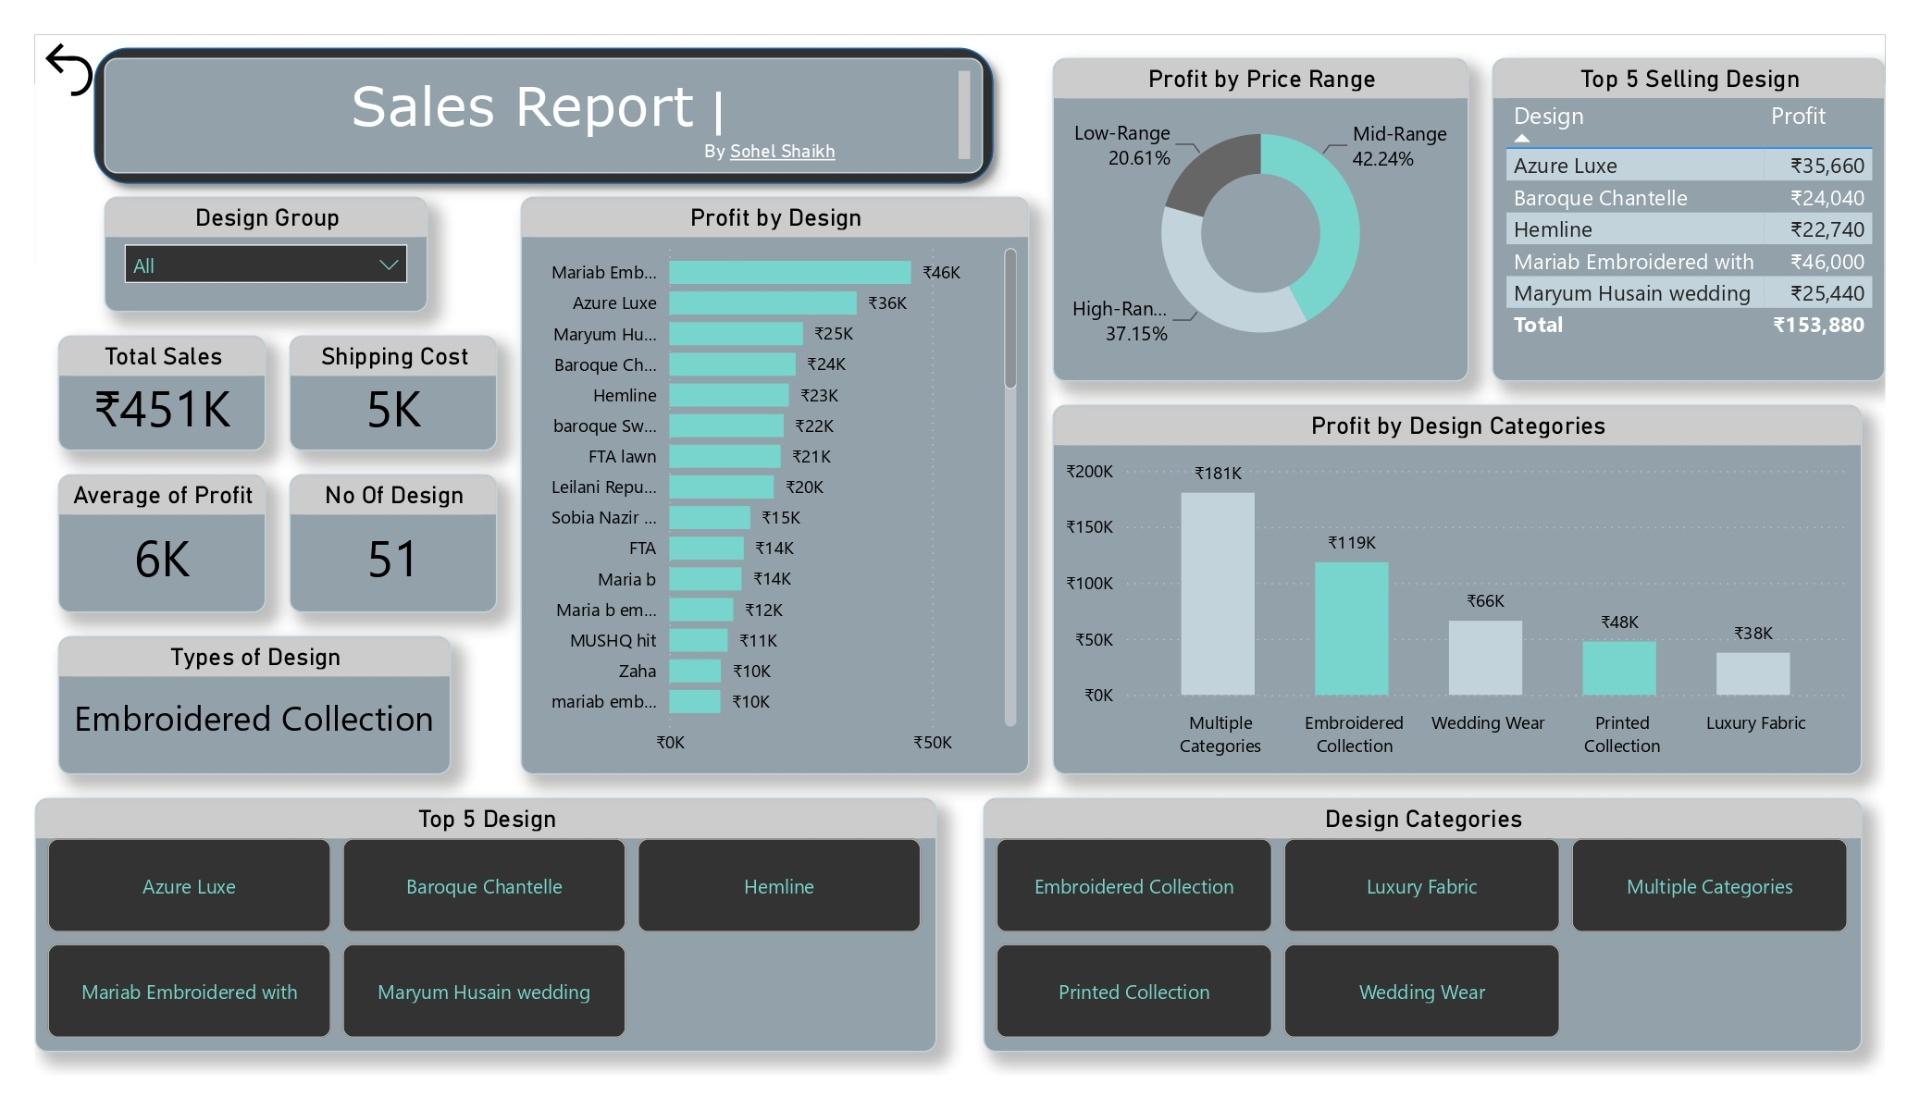
Tailor Fabric Sales Analysis Dashboard

Overview

A local fabric seller was maintaining sales records manually, making it difficult to identify profitable products and monitor business performance. I transformed the existing sales data into an interactive Power BI dashboard that provides clear insights into sales, profit, product performance, and category trends. This dashboard enables faster and more informed business decisions.

Problem Statement

The business relied on manual calculations and spreadsheets to monitor sales performance. Identifying the best-selling designs, profitable categories, and overall business performance was time-consuming and error-prone. The lack of an interactive reporting system made decision-making difficult.

Objectives

• Create a centralized sales dashboard. • Track overall sales and profit. • Identify the highest-performing designs. • Analyze profit across design categories. • Replace manual calculations with interactive reporting.

Dataset & Cleaning

Data Source

Sales transaction data provided by the business owner, including design names, categories, sales amount, profit, shipping cost, and pricing information.

Modeling & DAX

• Removed duplicate records. • Standardized design names. • Corrected inconsistent formatting. • Validated numeric values. • Checked for missing data before building the dashboard.

Key Performance Indicators

451k
Total Sales
5k
Shipping Cost
6k
Average Profit
51
Total Designs

Key Insights

The dashboard recorded total sales of approximately ₹451K.

Multiple Categories generated the highest overall profit.

Embroidered Collection was the second highest profit category.

Mariab Embroidered was the highest-profit individual design.

Mid-range products contributed the largest share of profit.

Recommendations

Increase stock availability for the highest-performing designs.

Promote embroidered collections through marketing campaigns.

Focus future inventory on the mid-range price segment.

Review low-performing designs for pricing or promotional improvements.

Business Impact

The dashboard helps the business owner quickly identify profitable products, monitor category performance, and make informed inventory and sales decisions based on real data instead of manual calculations.

Challenges Faced

  • Sales data was maintained manually.
  • Design names were inconsistent across records.
  • Cleaning and standardizing the dataset before analysis.

Learnings

  • Improved Power Query data transformation skills.
  • Applied DAX measures for business KPIs.
  • Designed an interactive Power BI dashboard for business reporting.
  • Converted raw sales data into actionable insights.

Tags

Power BISales AnalyticsBusiness IntelligenceData VisualizationRetail AnalyticsDashboard DesignData Cleaning

Project Gallery

Gallery Image 1