Welcome to my world

Hi, I'm
Sohel
Shaikh

Profile placeholder

Detail-oriented Data Analyst specializing in Power BI, SQL, DAX and Excel. I build interactive dashboards, automate reporting, and transform raw data into actionable business insights that help organizations make smarter decisions.

Profile

Available for

Freelance Work
Find with me

Best skill on

Profile placeholder 2

Power BI

Certified

About Me

Data Analysis
&
Visualization is what I do
best.

I am a passionate Data Analyst specializing in Power BI and SQL. I focus on delivering KPI-based reports, data modeling, and performance optimization to support data-driven business decisions.

Exploratory Analysis

Deep diving into datasets to discover patterns, anomalies, and relationships using SQL, Excel, and Power BI.

Business Intelligence

Building interactive dashboards and automated reporting systems using Tableau, Power BI, and SQL.

80+

Projects
Done

50+

Happy
Clients

98%

Success
Rate

Expertise

My Skills

Technical Skills

SQL & ETL
95%
Data Visualization
90%
Data Modeling
85%
Data Cleaning
92%
Advanced Excel
90%

Software & Tools

Power BITableauPower QueryDAXSQL ServerExcel (Advanced)MS WordPowerPointData ModelingVS Code

"Data is the new oil, but only if you know how to refine it. My toolkit is built to transform complex datasets into high-value business assets."

Professional History

Work Experience

PwC (Forage) logo

Power BI Virtual Experience

PwC (Forage) • Virtual Experience

Oct 2024 - Feb 2025
  • Built interactive Power BI dashboards using business datasets.
  • Created DAX measures, KPIs, and analytical reports for customer churn and workforce insights.
  • Performed data transformation using Power Query and optimized dashboard performance.
  • Presented actionable business insights through interactive visualizations.
Power BI Developer & Data Analyst logo

Personal Portfolio

Power BI Developer & Data Analyst • Personal Project

Jan 2025 - Present
  • Designed and developed interactive Power BI dashboards using SQL, Excel, Power Query, and DAX.
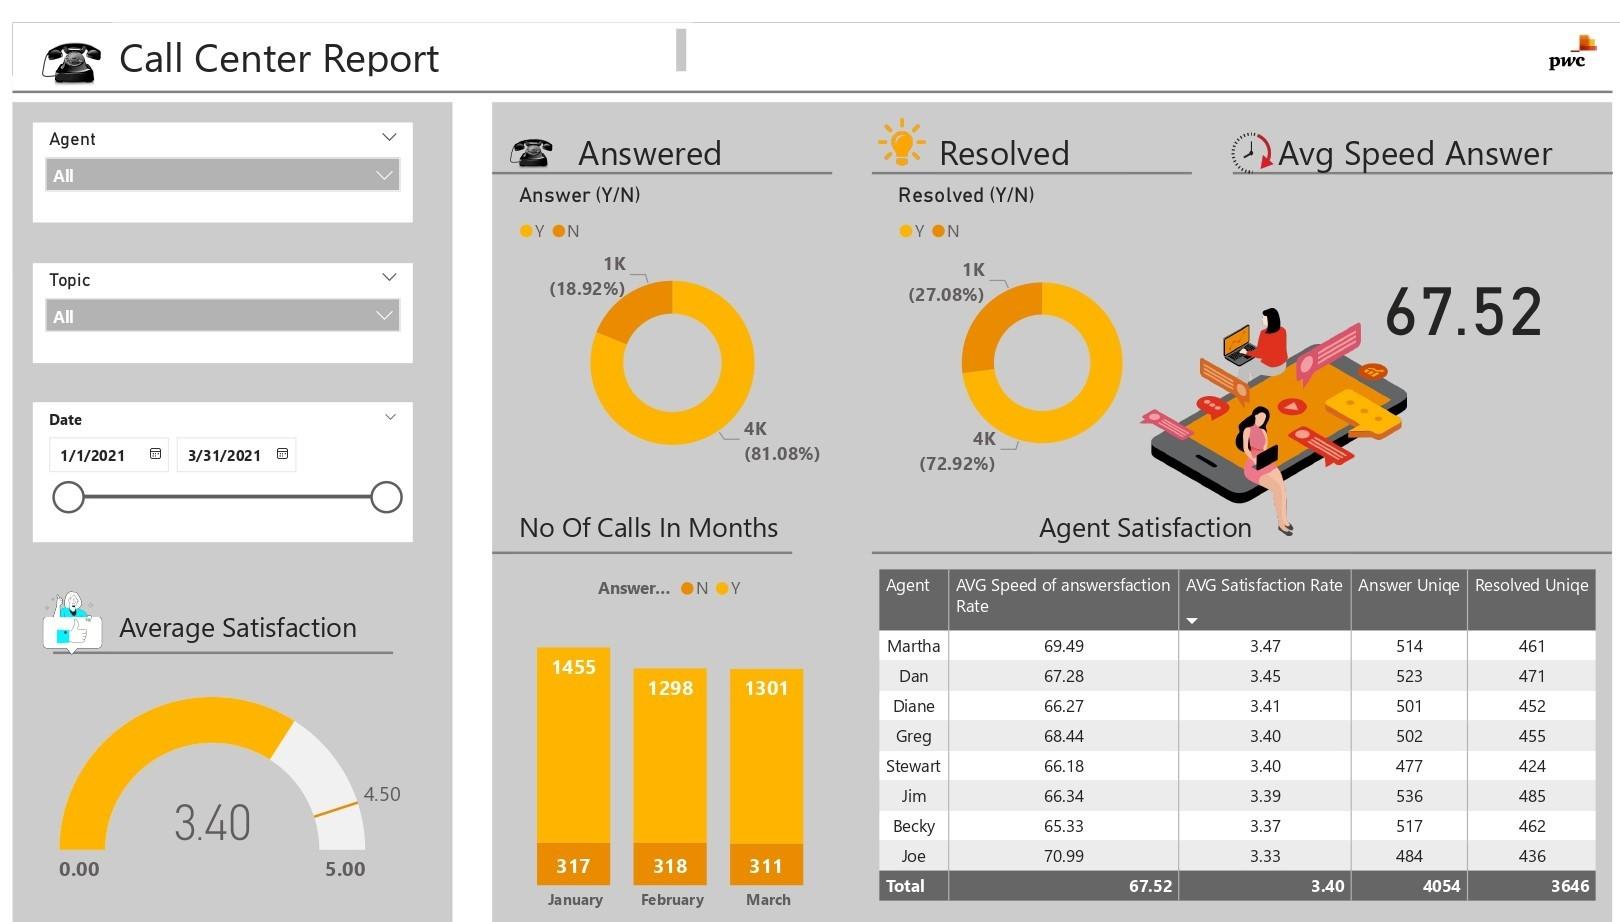
  • Built real-world analytics projects including Customer Churn, HR Diversity & Inclusion, Mobile Sales, Tailor Fabric Sales, and Call Center Analysis.
  • Performed data cleaning, data modeling, KPI development, and dashboard optimization for business reporting.
  • Developed a fully responsive portfolio website using Next.js, TypeScript, Tailwind CSS, and Supabase with a dynamic CMS.
Accenture (Forage) logo

Data Analytics Virtual Experience

Accenture (Forage) • Virtual Experience

Feb 2025 - May 2025
  • Cleaned and prepared datasets for analysis and reporting.
  • Built visual dashboards to communicate business insights effectively.
  • Applied data storytelling techniques to explain trends and support recommendations.
  • Presented analytical findings using industry-standard visualization practices.
Tata (Forage) logo

Data Visualisation Virtual Experience

Tata (Forage) • Virtual Experience

Oct 2024 - Nov 2024
  • Designed business dashboards based on stakeholder requirements.
  • Selected appropriate charts to improve business communication.
  • Presented insights using effective visualization techniques.
  • Improved data storytelling through structured dashboard design.
Visit my projects and keep your feedback

My Projects

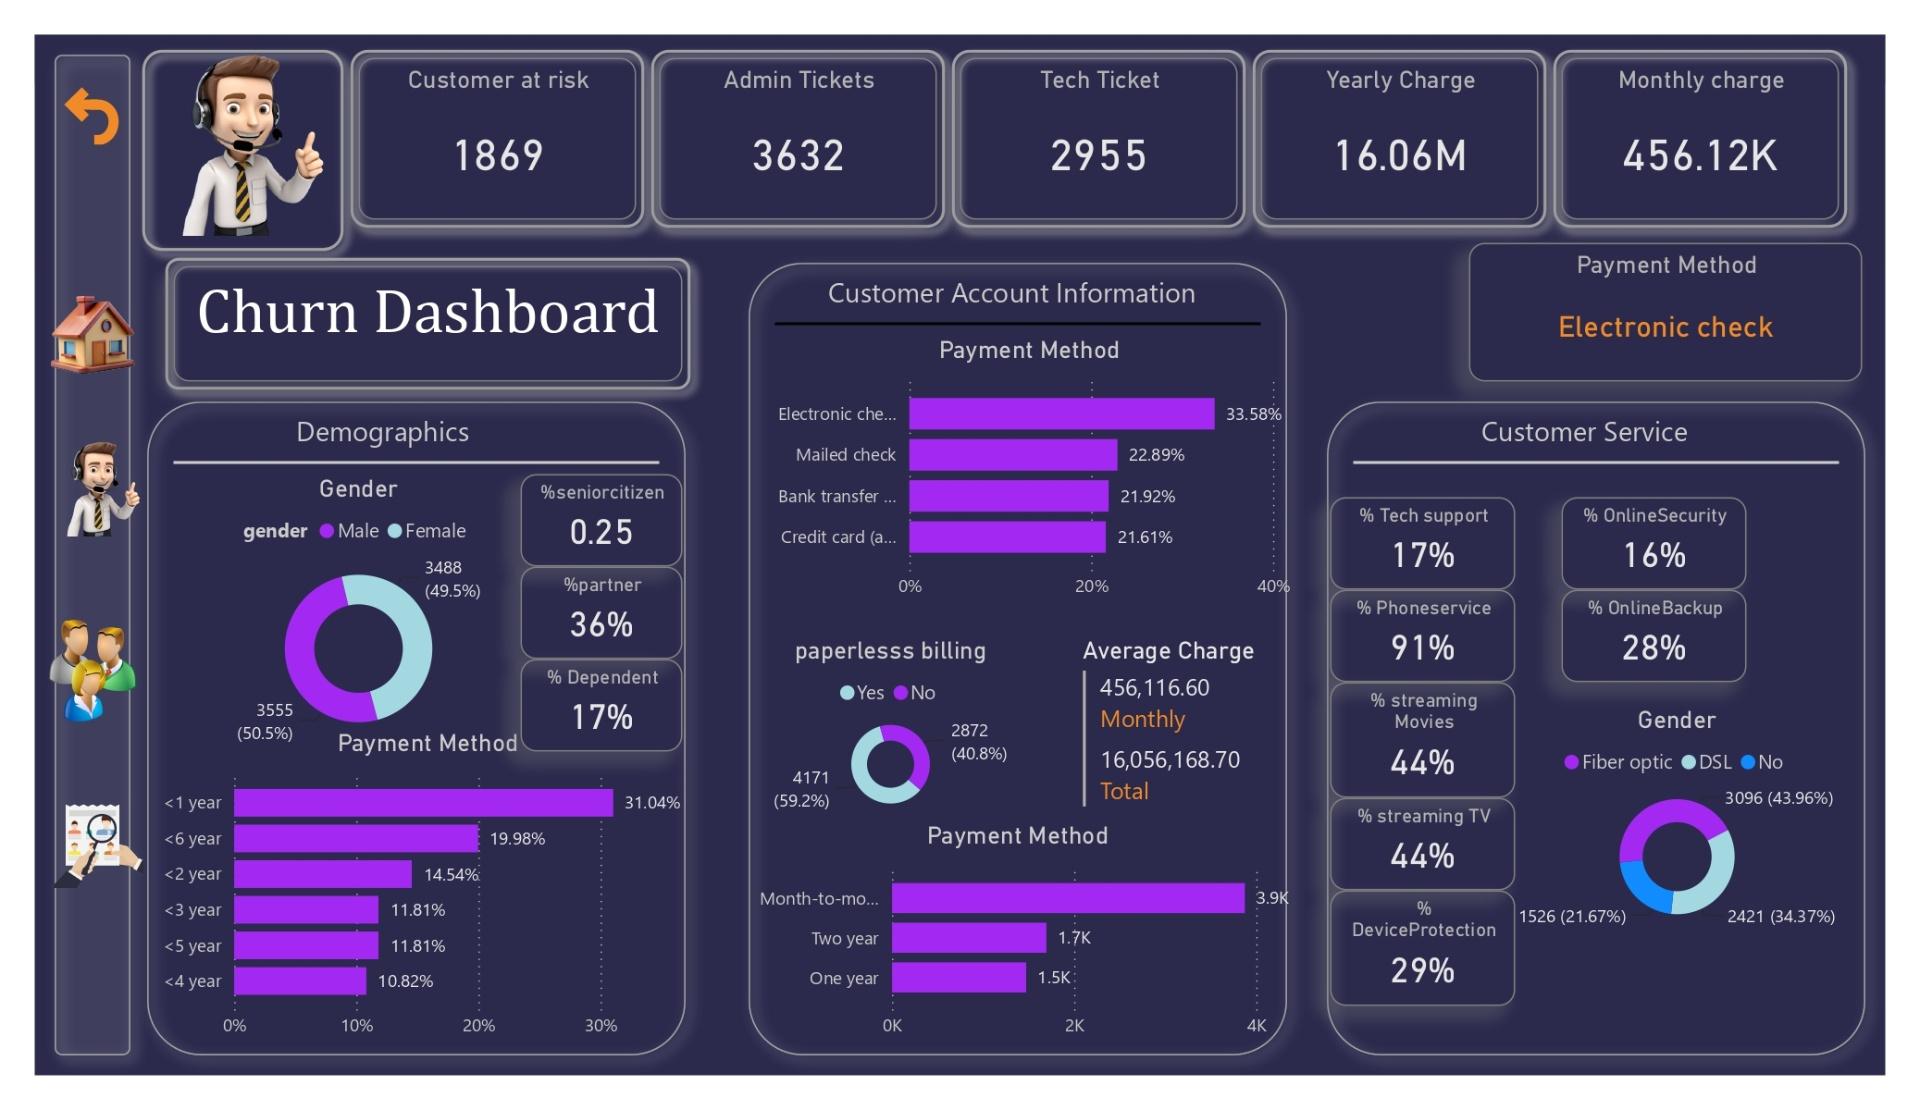
Telecom Customer Churn Analysis Dashboard
Power BI

Telecom Customer Churn Analysis Dashboard

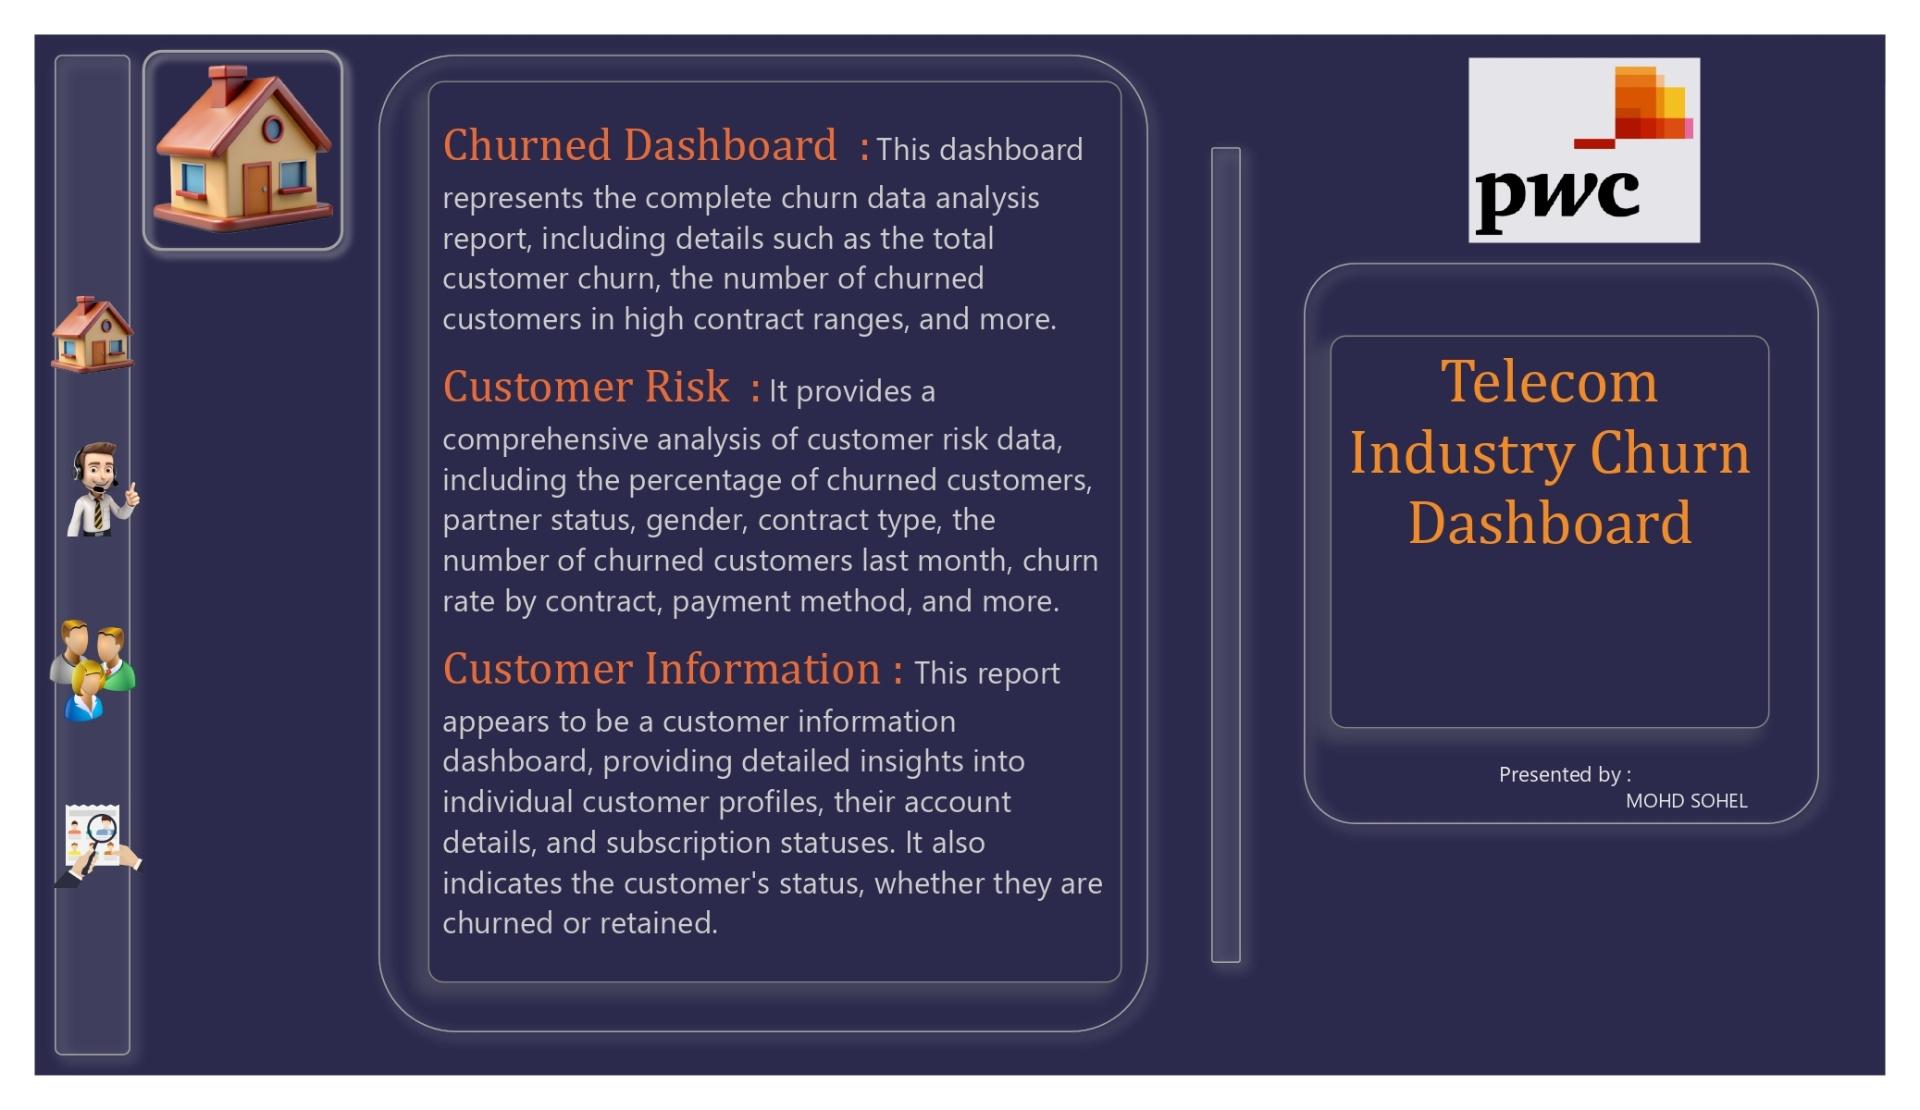
Developed an interactive Power BI dashboard during the PwC Forage Virtual Experience to analyze telecom customer churn, identify high-risk customers, and present actionable business insights using dynamic visualizations and KPI reporting.

View Project
GitHub
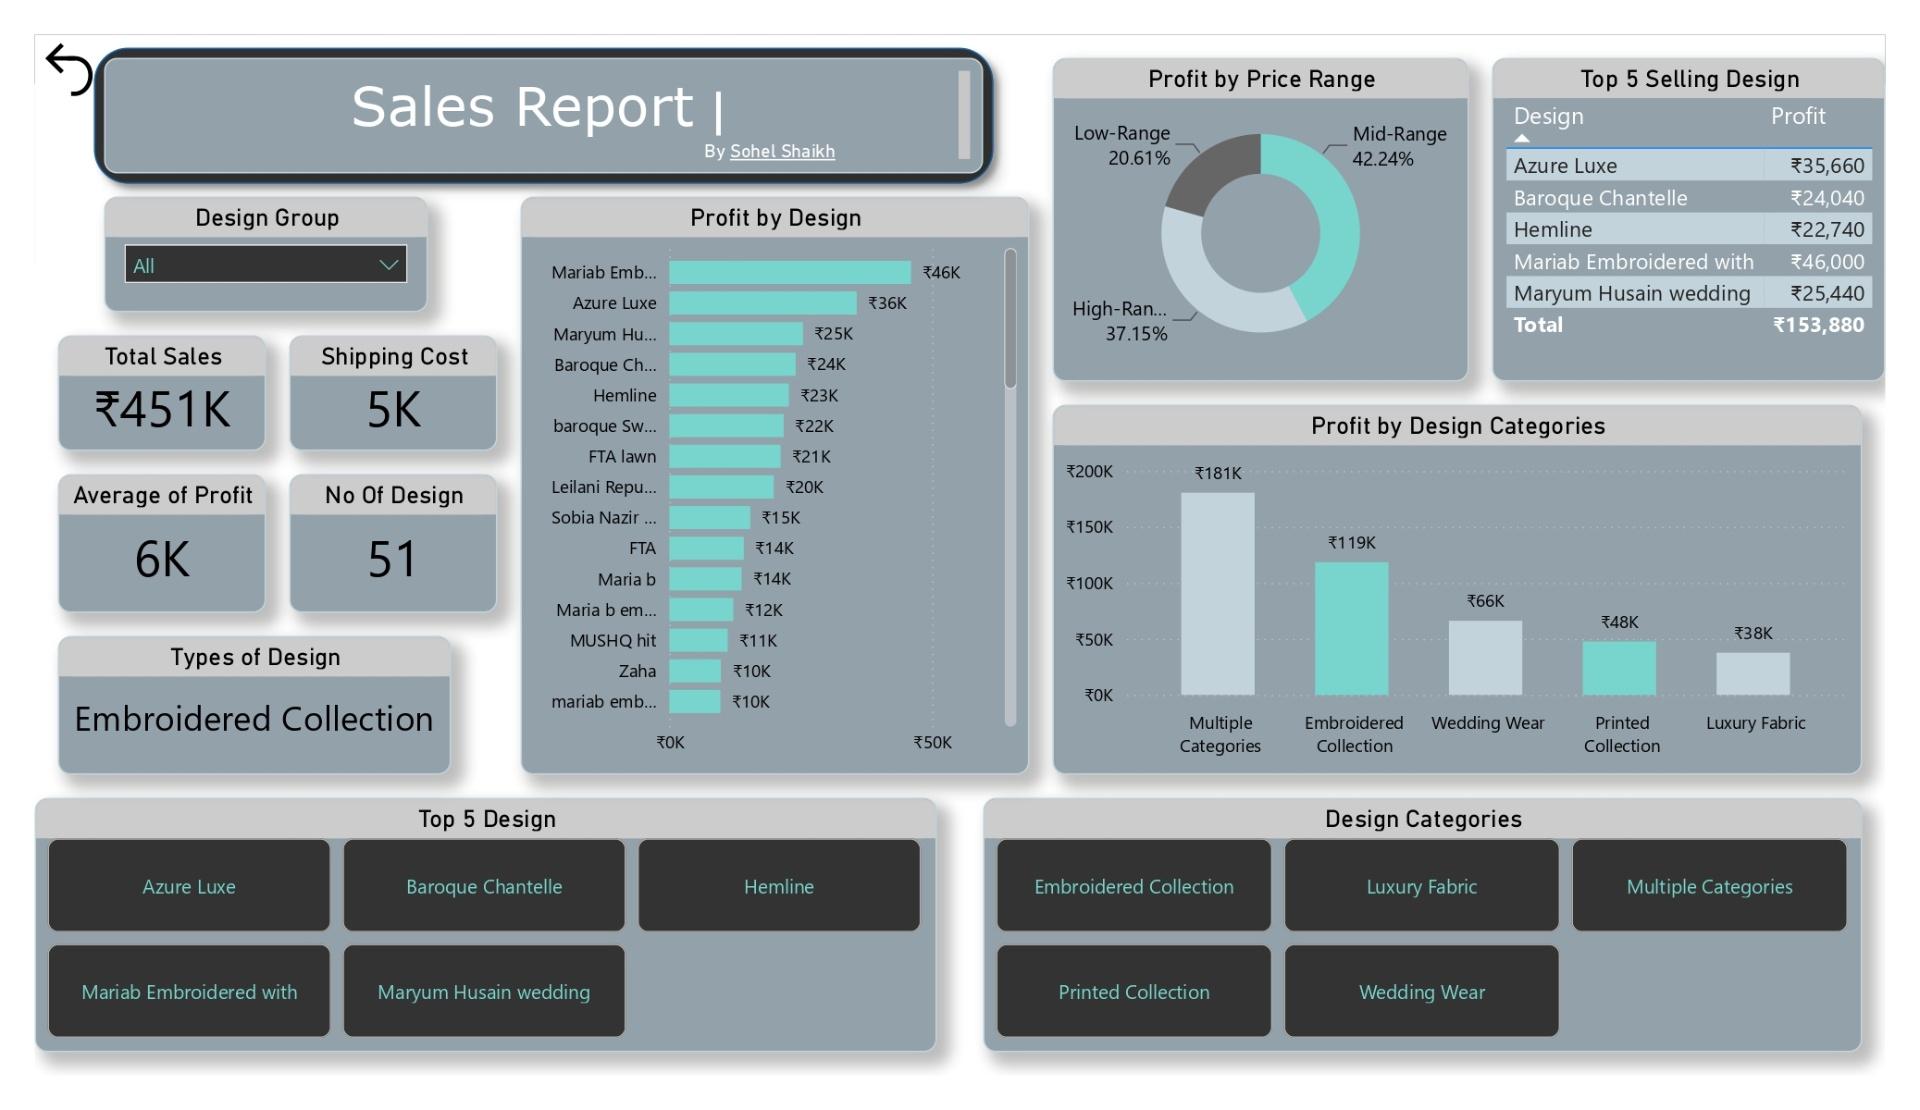
Tailor Fabric Sales Analysis
Power BI / Data Analysis

Tailor Fabric Sales Analysis

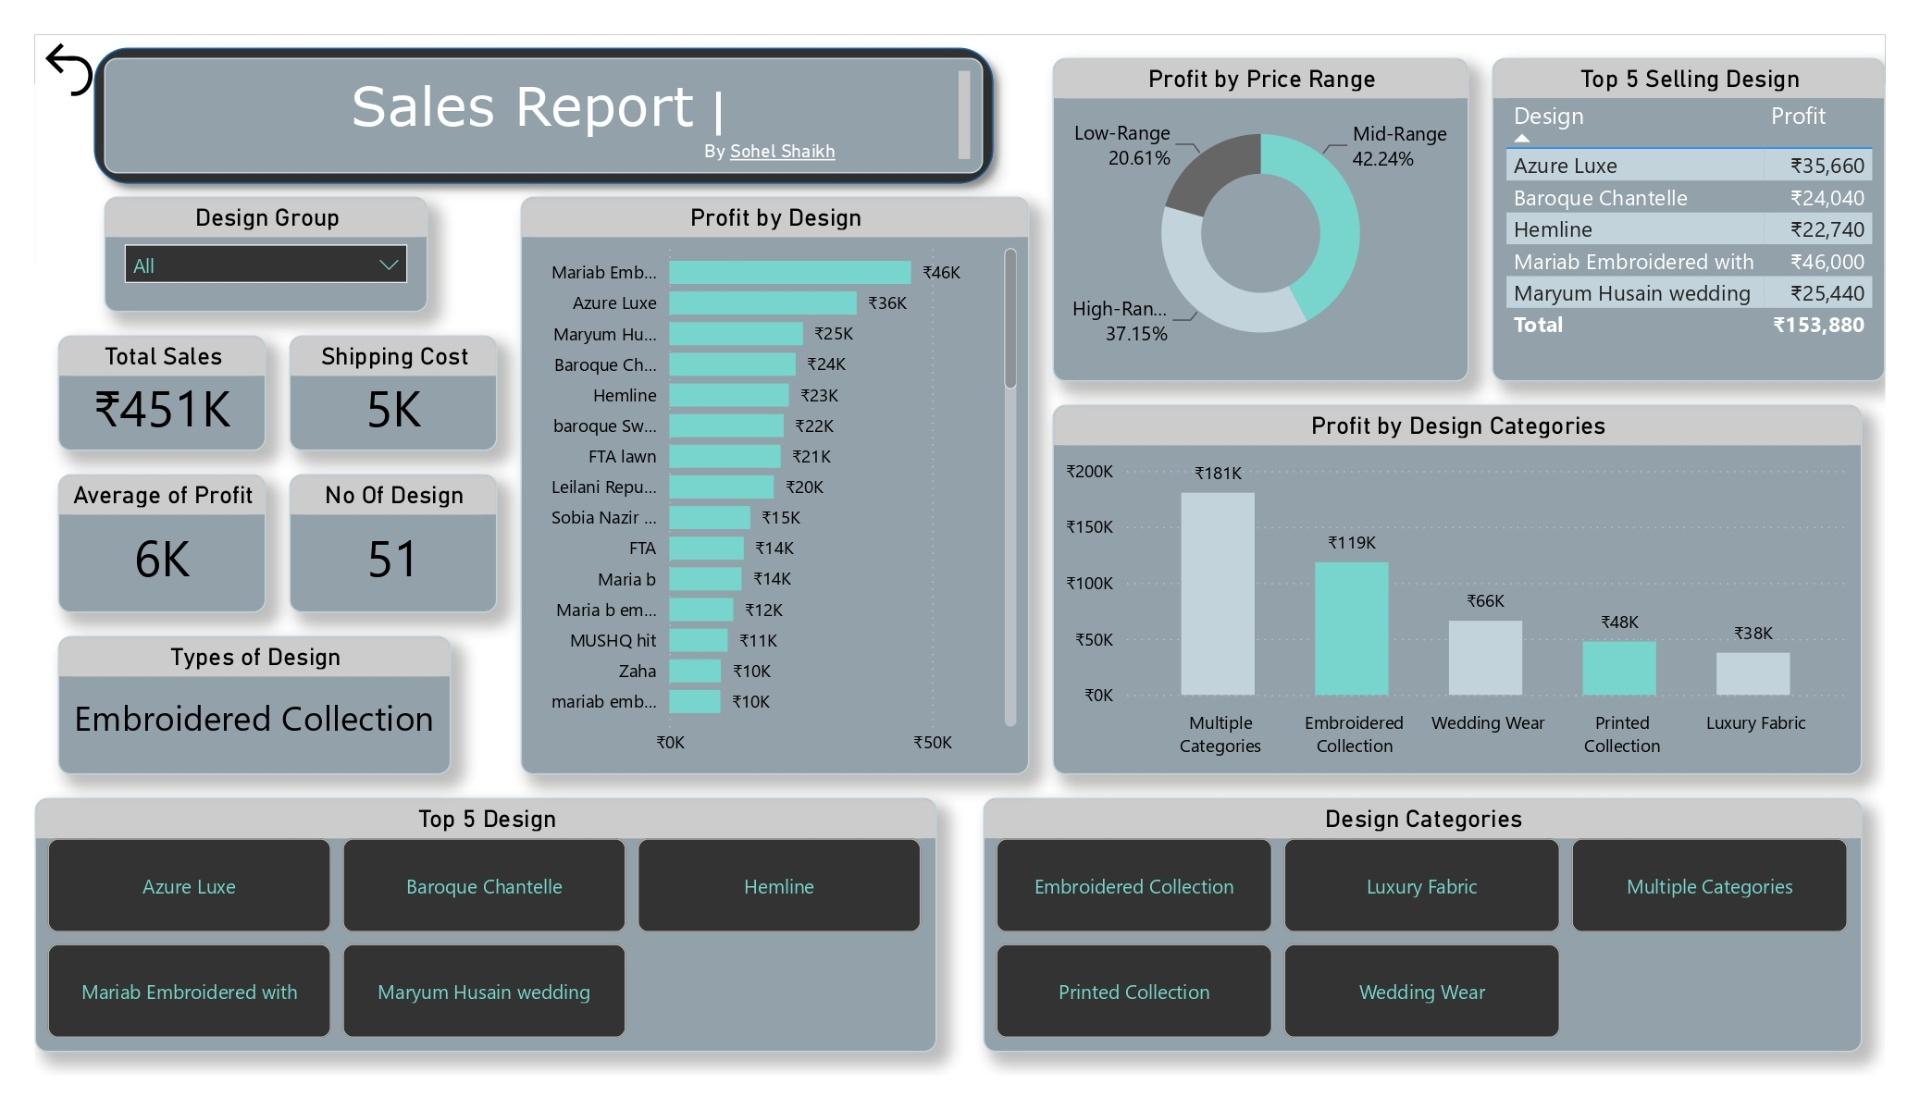
Designed an interactive Power BI dashboard to analyze fabric sales, product performance, and profitability. The dashboard helps track sales trends, identify high-performing designs, and support business decisions through clear visual insights.

View Project
GitHub
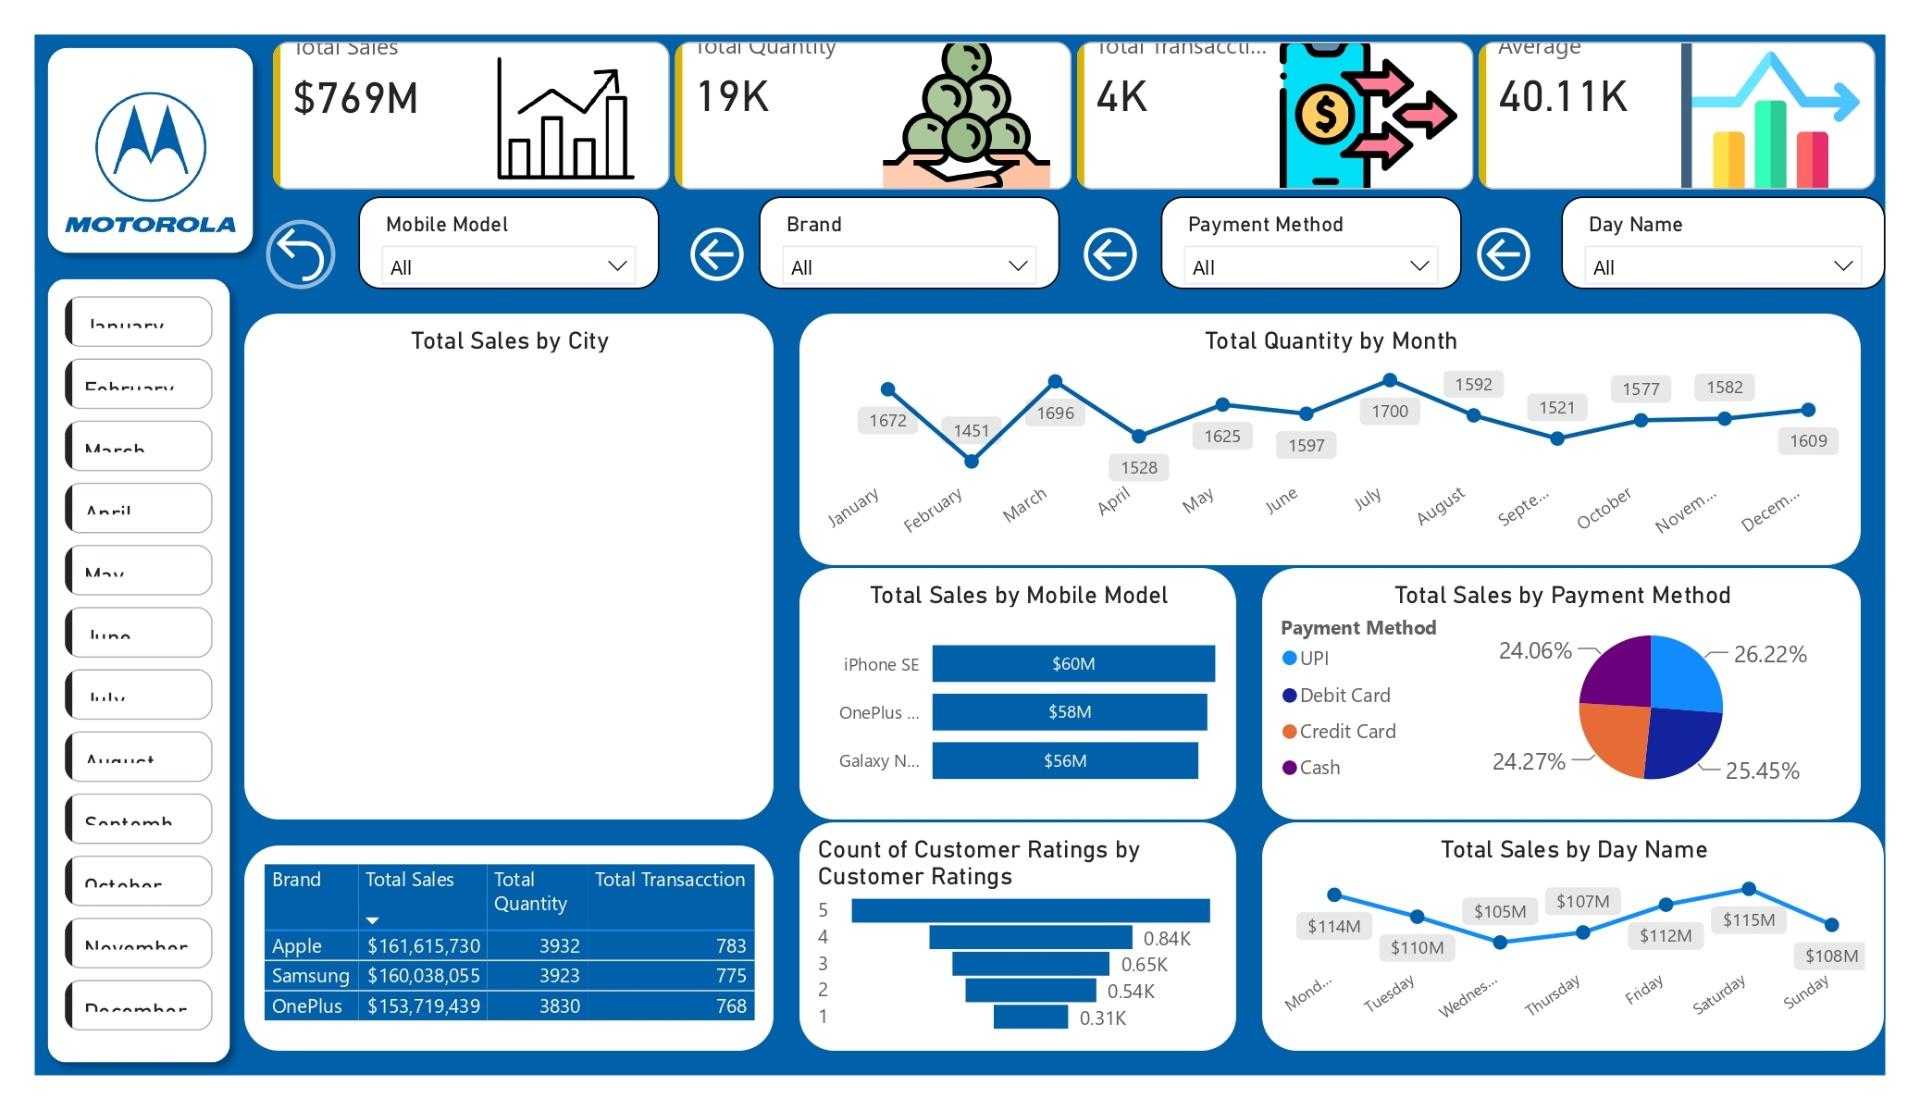
Mobile Sales Analysis
SQL / Power BI

Mobile Sales Analysis

Designed an interactive Power BI dashboard to analyze mobile phone sales across different brands, cities, payment methods, and time periods. The dashboard helps track sales performance, customer purchasing patterns, and product demand through interactive visualizations.

View Project
GitHub
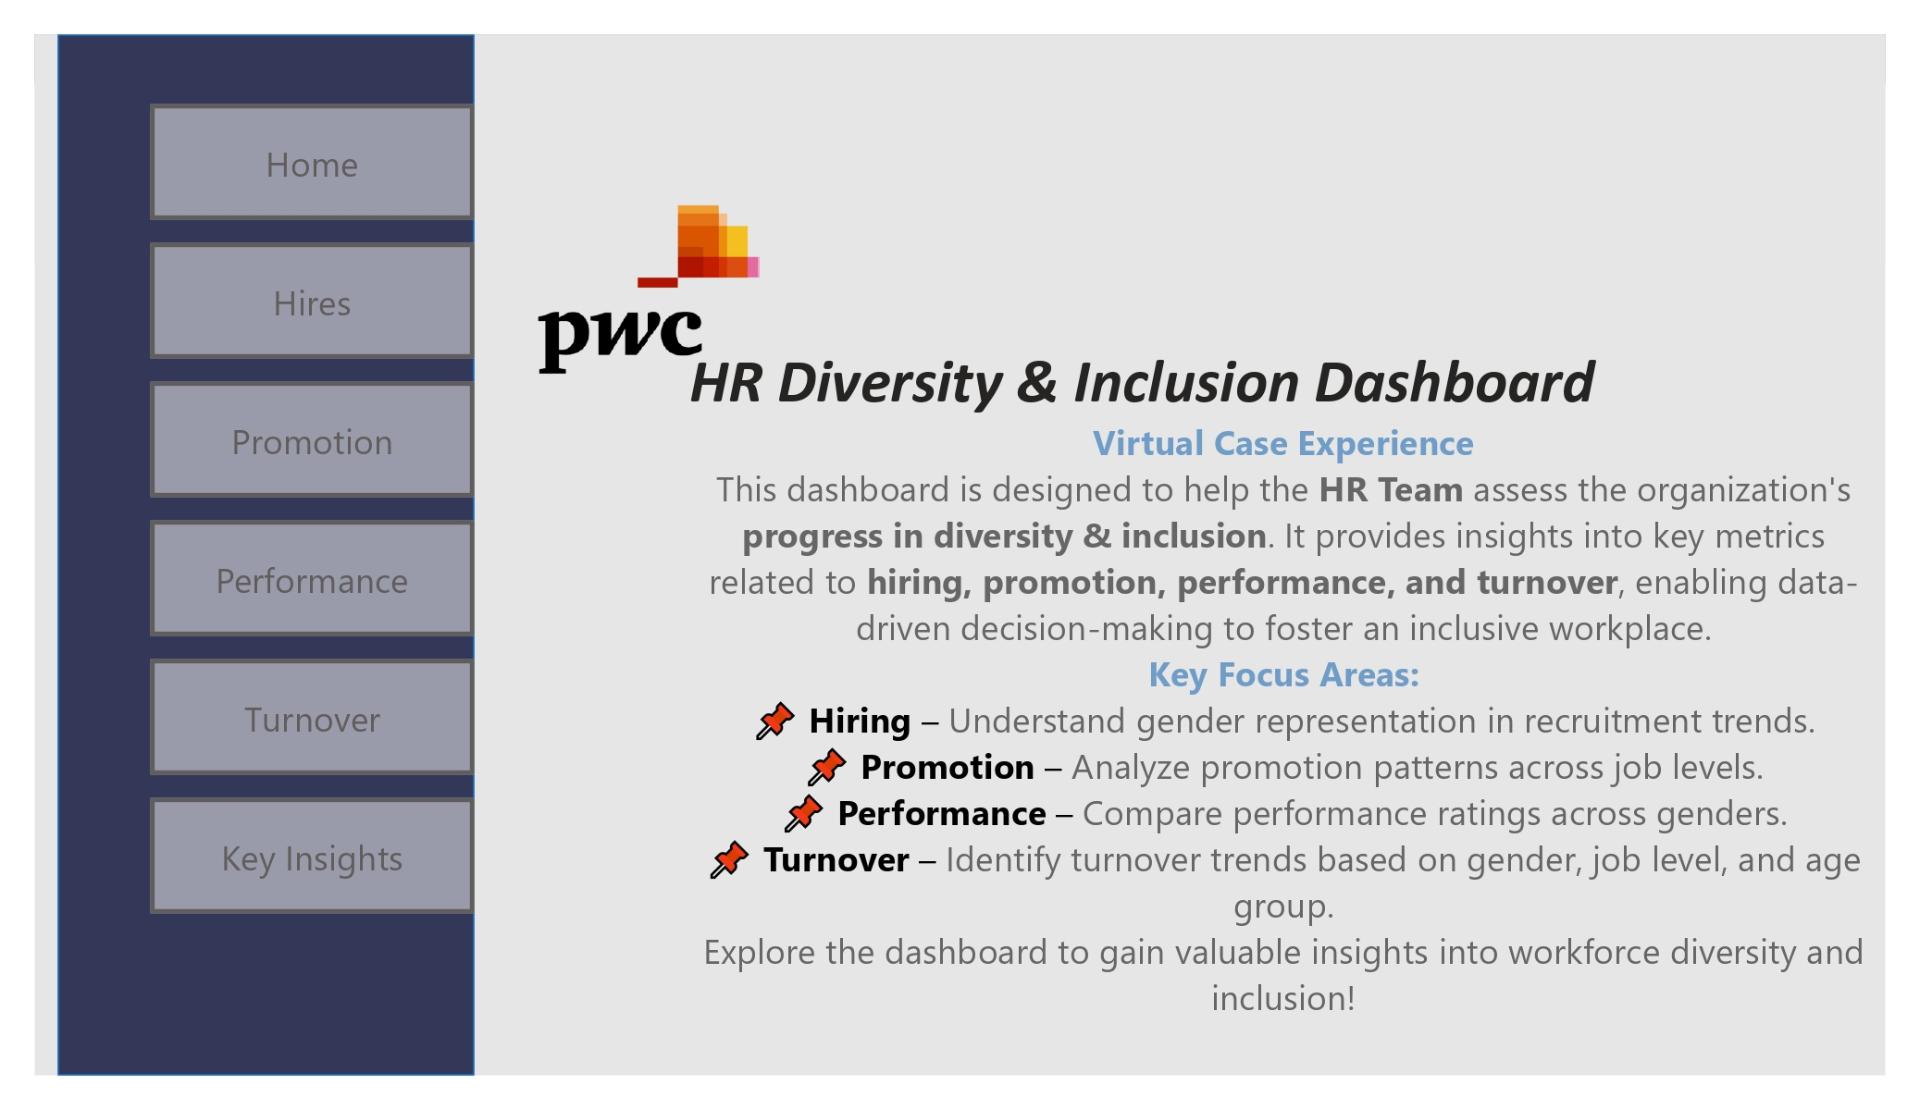
HR Diversity & Inclusion Dashboard
Power BI / HR Analytics

HR Diversity & Inclusion Dashboard

Developed an interactive HR analytics dashboard as part of the PwC Forage Virtual Experience Program to analyze workforce diversity, hiring trends, promotions, employee performance, and turnover. The dashboard enables HR teams to monitor diversity metrics, identify workforce gaps, and support data-driven decision-making.

View Project
GitHub
Continuous Learning & Growth

Certifications

Tata Group (Forage)Nov 26, 2024

Data Visualisation: Empowering Business with Effective Insights

Completed Tata Group's Data Visualisation virtual job simulation through Forage. Worked on practical business scenarios focused on selecting the right visualizations, presenting data effectively, and communicating business insights to stakeholders. The experience strengthened my ability to transform business requirements into meaningful dashboards and data-driven recommendations.

SkillCourseMay 18, 2025

Power BI Micro Course

I'm happy to share that I have successfully completed the Power BI program from SkillCourse by Satish Dhawale Sir. Throughout this journey, I learned: ✅ How to clean and model raw data ✅ Create meaningful KPIs using DAX ✅ Build interactive dashboards with real-time filters ✅ Solve real-world business scenarios with Power BI A big thank you to Satish Dhawale Sir for his practical, real-life teaching style and continuous motivation. This course has strengthened my confidence and skill set as a Power BI Developer / Data Analyst.

AccentureMay 30, 2025

Data Analytics and Visualization Job Simulation

Completed Accenture's Data Analytics and Visualization Job Simulation through Forage. Worked on practical business scenarios involving project understanding, data cleaning, data modeling, dashboard creation, data visualization, storytelling, and presenting analytical findings to stakeholders. The simulation strengthened my ability to convert raw business data into meaningful insights using industry-standard analytical practices.

PwC Switzerland (Forage)Feb 16, 2025

Power BI Job Simulation

Completed PwC Switzerland's Power BI Job Simulation through Forage, working on real-world business scenarios involving customer retention, call center performance, and workforce diversity analysis. Built interactive Power BI dashboards, transformed raw datasets, and presented business insights using data visualization and reporting techniques similar to those used in professional analytics projects.

Detailed Analytics Walkthrough

Case Studies

Telecom Customer Churn Analysis Dashboard
PwC Forage Virtual Experience

Telecom Customer Churn Analysis Dashboard

Built an interactive Power BI dashboard during the PwC Forage Virtual Experience to analyze telecom customer churn, identify high-risk customers, and present actionable business insights through interactive visualizations and KPI reporting.

Power BICustomer AnalyticsTelecom AnalyticsBusiness IntelligencePwC ForageData VisualizationPower QueryDAXCustomer Churn
Tailor Fabric Sales Analysis Dashboard
Local Fabric & Tailoring Business

Tailor Fabric Sales Analysis Dashboard

An interactive Power BI dashboard developed to analyze fabric sales, profitability, design performance, and category-wise business trends, replacing manual calculations with data-driven reporting.

Power BISales AnalyticsBusiness IntelligenceData VisualizationRetail AnalyticsDashboard DesignData Cleaning
Features

Service

Power BI Dashboard Development

Building interactive Power BI dashboards that transform raw data into clear, actionable business insights through modern visualizations and KPI reporting.

Data Analytics & Business Intelligence

Analyzing business data to identify trends, measure performance, and support smarter business decisions with interactive reporting solutions.

SQL Data Analysis

Writing efficient SQL queries to clean, retrieve, transform, and analyze data for reporting, dashboard development, and business insights.

Excel & Power Query Automation

Cleaning, transforming, and preparing datasets using Advanced Excel and Power Query to improve reporting accuracy and reduce manual work.

Dashboard Design & Data Visualization

Designing modern, user-friendly dashboards with meaningful KPIs, interactive filters, and compelling visual storytelling for business users.

Data Cleaning & Data Modeling

Preparing high-quality datasets through data cleaning, transformation, relationship modeling, and DAX measures to build reliable analytical solutions.

Ready to elevate your data?

Let's discuss how we can transform your reporting and analytics into actionable business intelligence.

Call Me

+91 7718938615

Email Me

sohel82.shaikh@gmail.com

Chat on WhatsApp